In rail transport, the planning of train traffic and infrastructure maintenance requires coordination
In the planning and development of operations, maintenance needs information on the use of actuators, failure situations and their causes. Huge amounts of data are generated from sensors, actuators and systems, the utilization and understanding of which require industry expertise, powerful data analytics tools and visualization capabilities – Proxion masters all of these.
In examining the effects of railway capacity and railway work projects in South-Eastern Finland, the effects of train traffic and railway projects on capacity and the effects of work scheduling on the Hamina / Kotka – Joensuu section were examined. Timetables, track work plans and track infrastructure information were utilized in the analysis work. The analysis used capacity utilization calculations, disturbance analyses and created a multi-factor indicator describing the capacity status. Data visualization was carried out, e.g. with thermal map images of train delays.
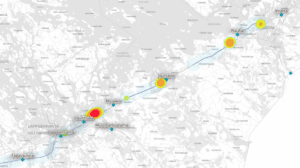
The Safety Equipment Failure Reporting and Utilization project investigated the development targets of the level crossing facility failure notification information flow process, the incidence of failures from the perspective of various factors, and identified needs to improve data quality to enable real-time reporting. The analysis of failures utilized data from the customer’s system as well as data from open interfaces, which were combined for analytical work. One of the factors examined was the effect of lightning on the incidence of failures, which is accompanied by a map image of the points of impact and the failed warning facilities.
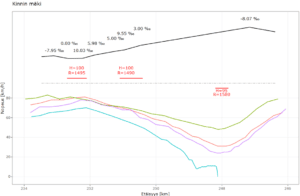
The Getting Stuck on a Hill analysis examined the possible causes for trains getting stuck uphill in sections with challenging ascents. The analysis utilized train location and speed data and weather data from the open interface and compared them with track geometry data. In addition to a normal report, the results were made into an interactive browser-based version to view data for individual trains at different points and different hill sections.
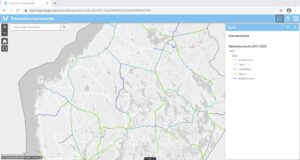
The condition indicator map of the track network shows the condition classification of the tracks visually on the map template. We have been producing condition classification data for several years, which are based on the measurement results of the track inspection wagon. The results and their development can be studied annually. Rail failure data have been used in the production of the data, coordinate transformations have been made and classifications have been calculated before exporting to the application database.